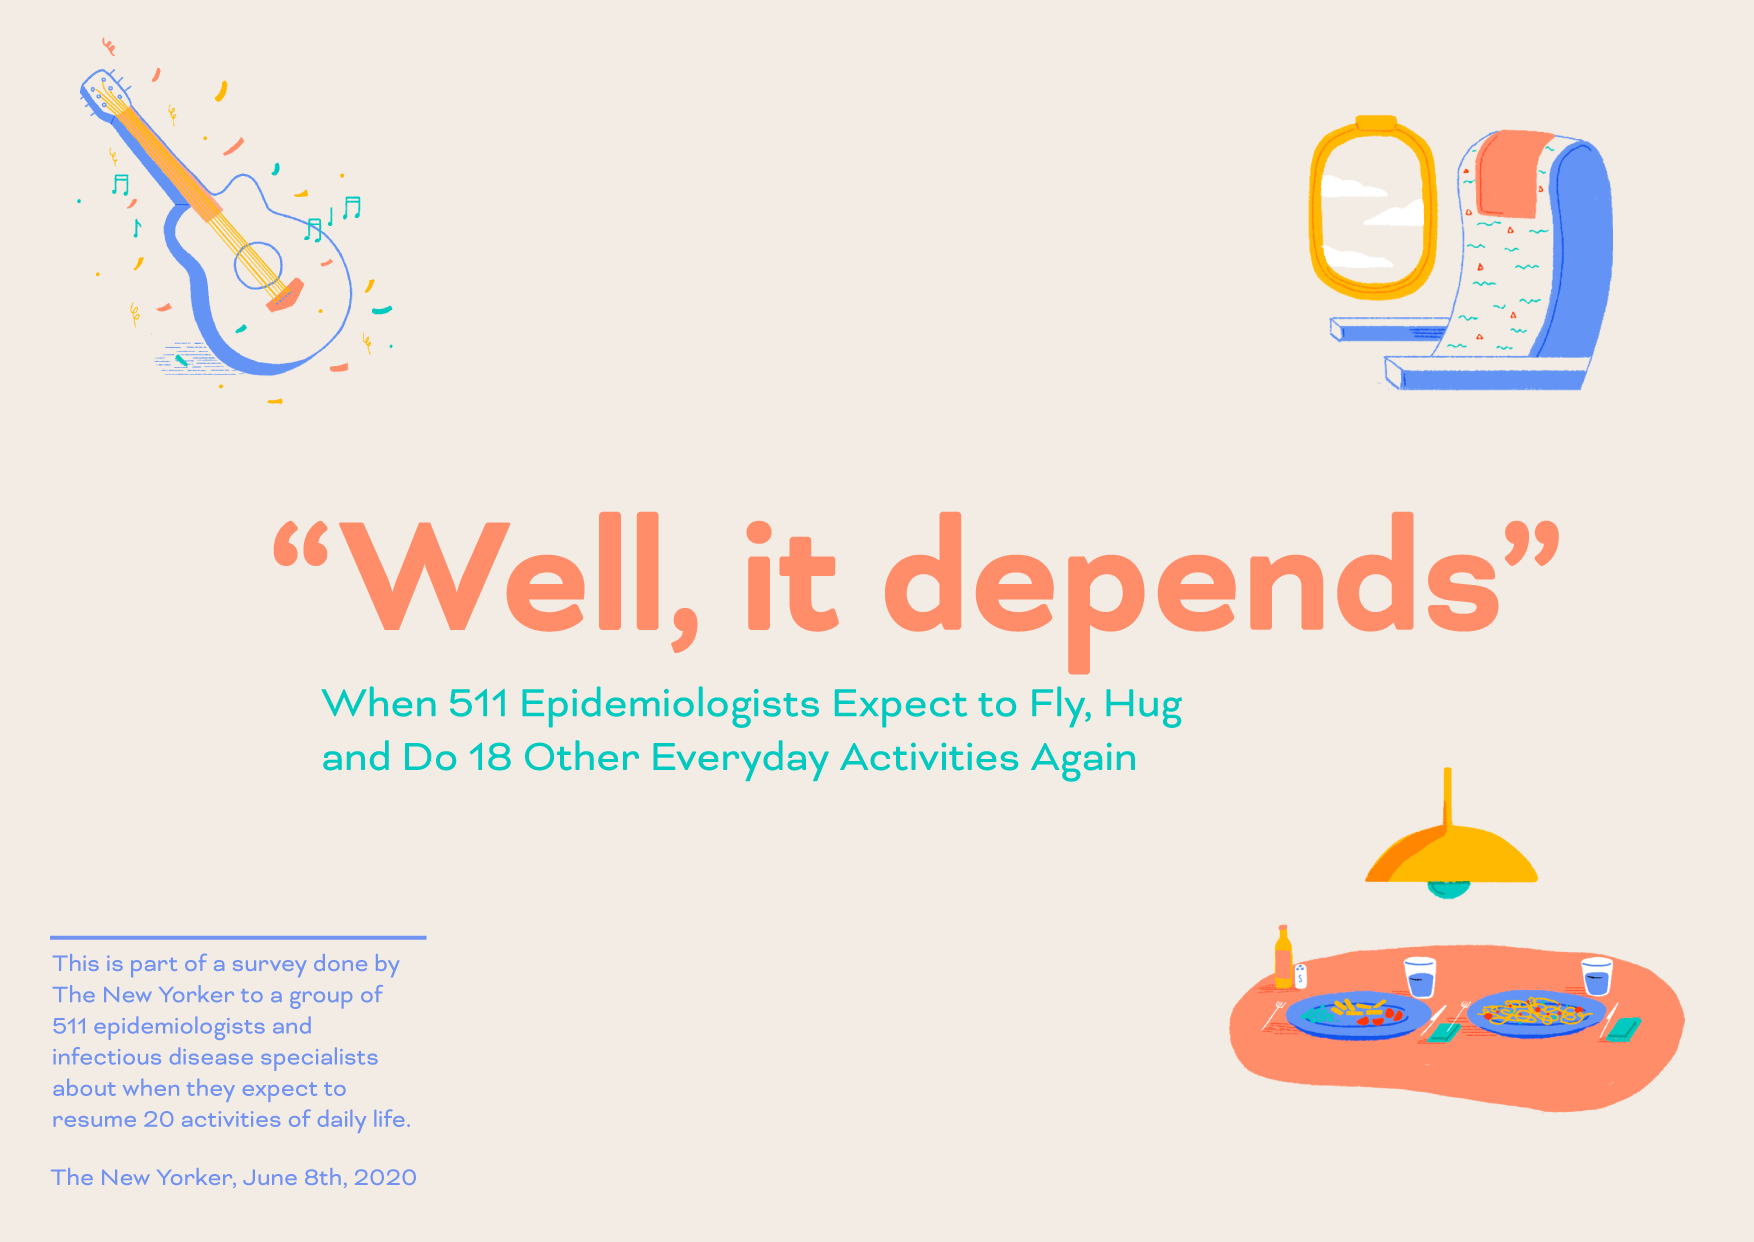
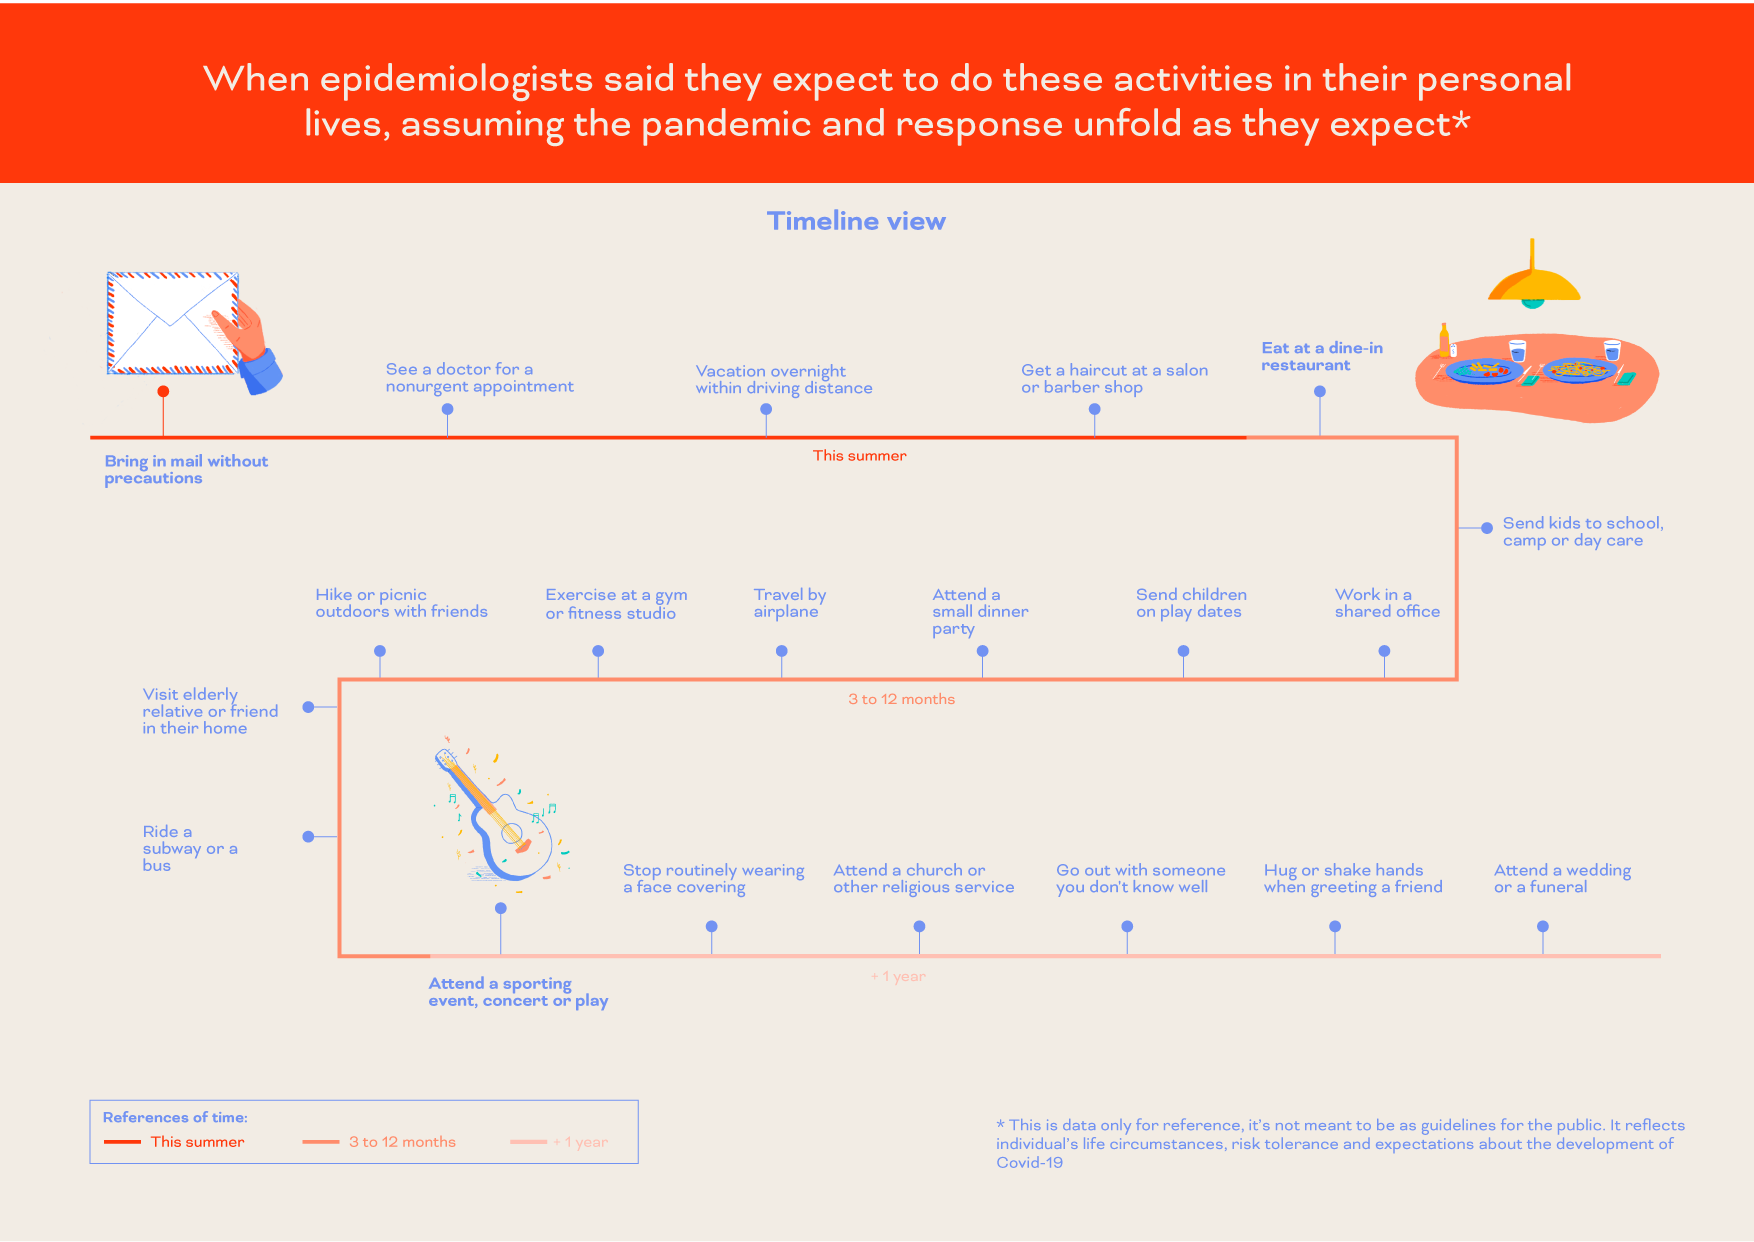
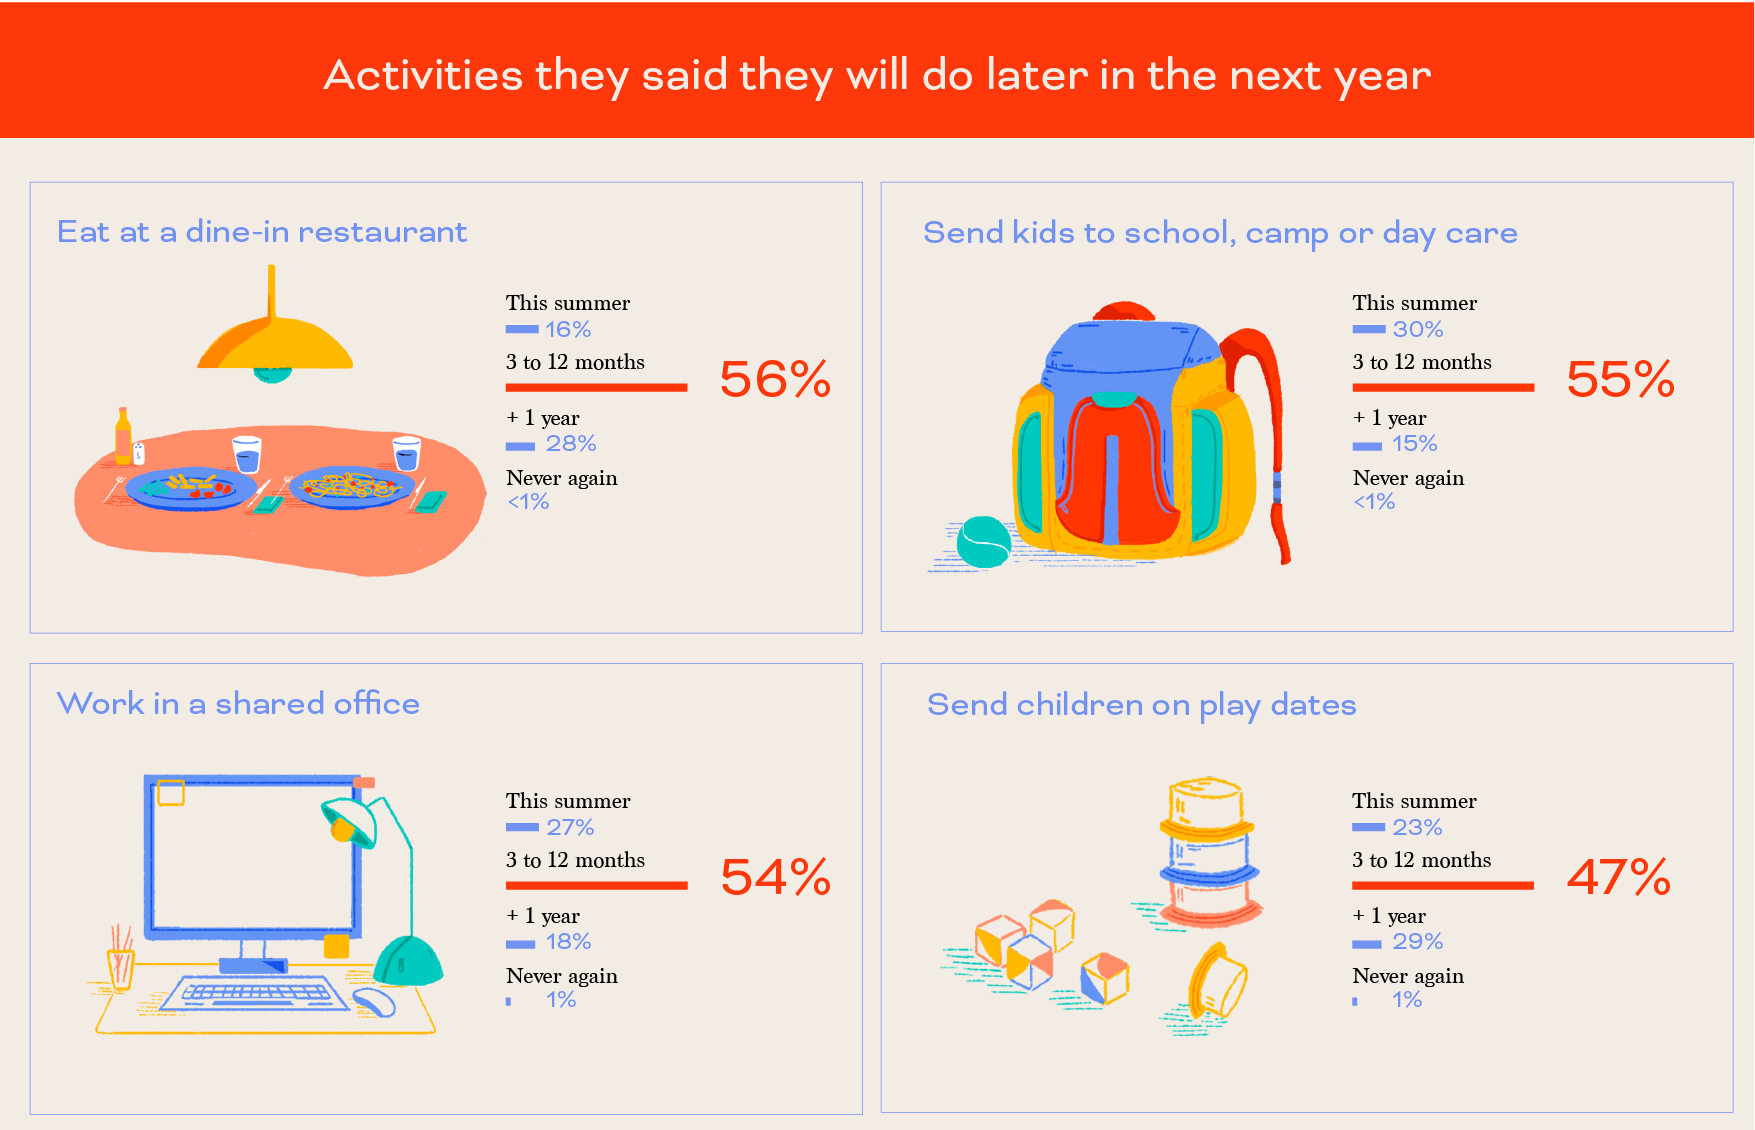
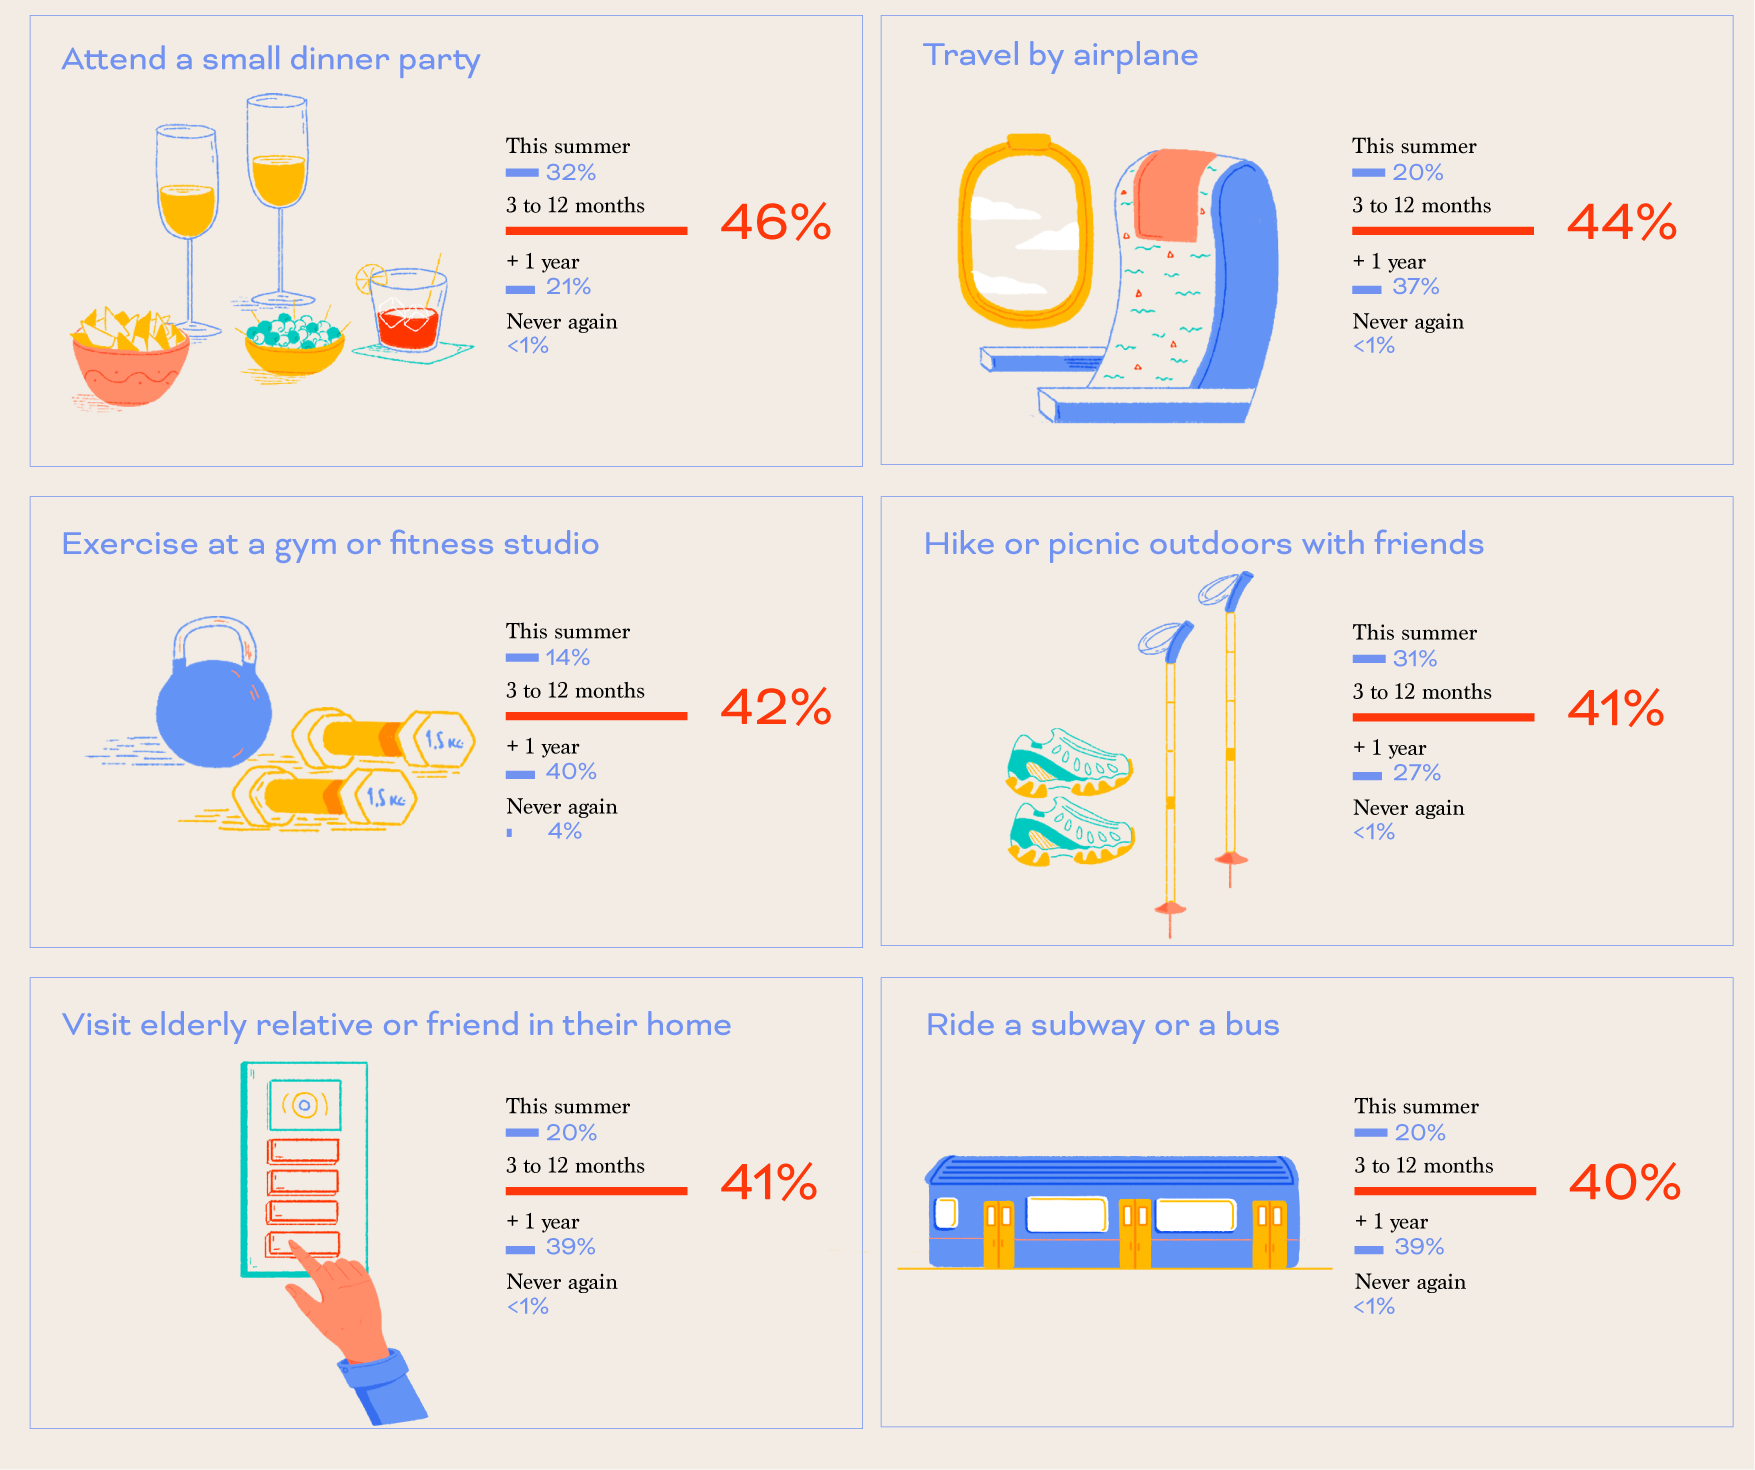
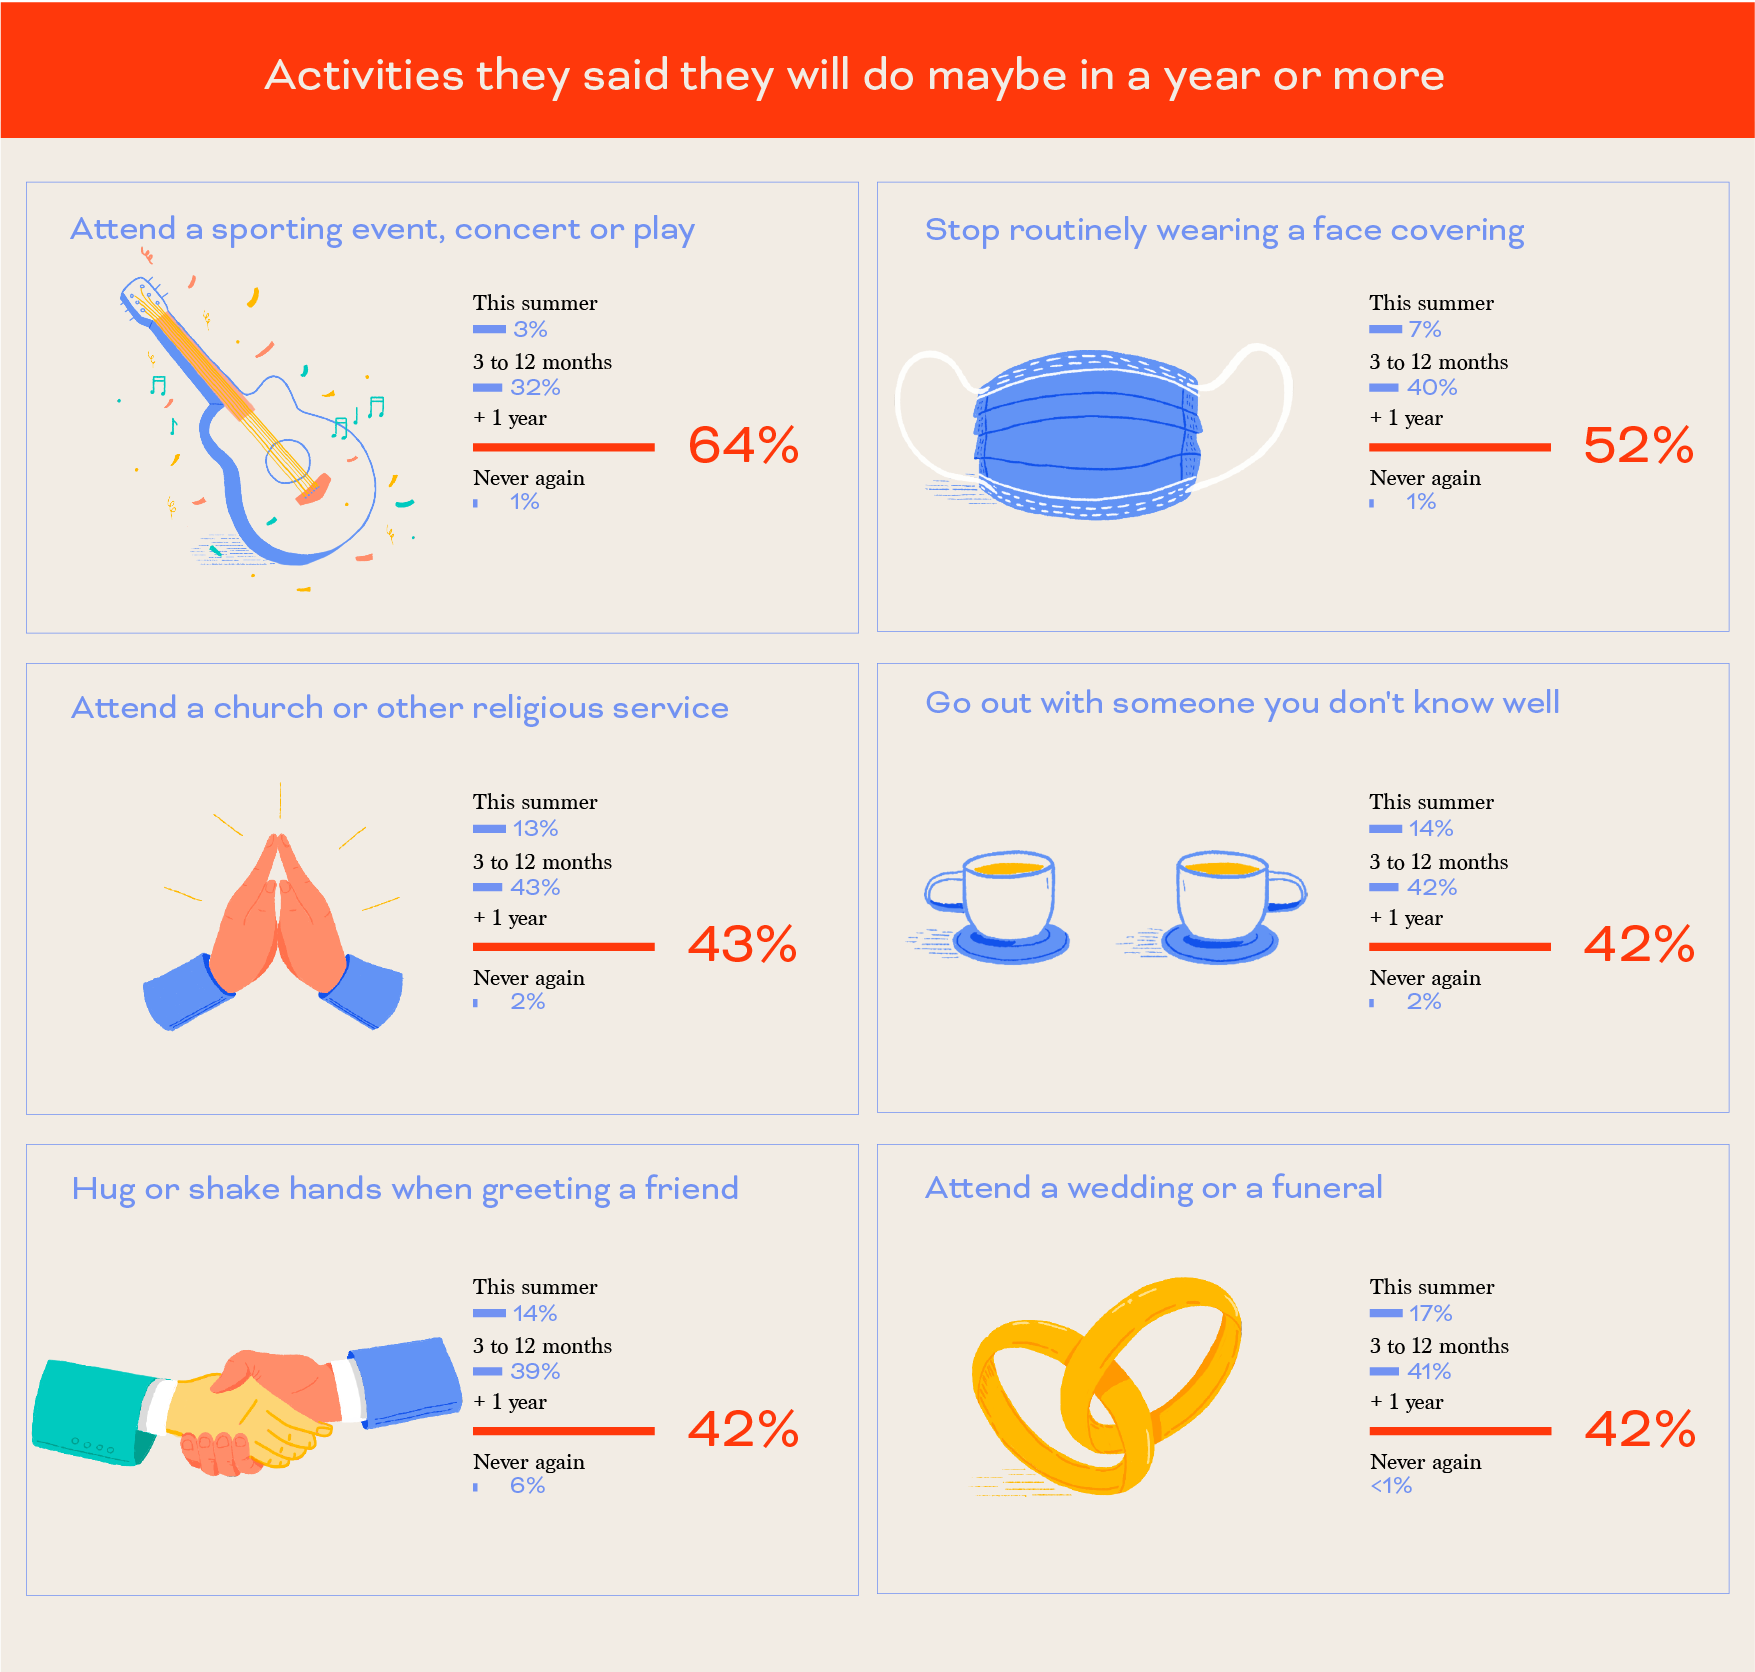
This is a self-initiated project. Data and its visualization are one of the tasks that I like to do the most. Particularly on this, I used the information from the survey carried out by The New York Times to a number of epidemiologists about the activities that would start soon or not after the Covid-19 and transformed it into an illustrated infographic.

Illustrations